Log in
 Free Trial
 jacob-thomason
  59 views
  0
0
The rental market continued to change in 2026 as more people chose renting over homeownership. Rising housing costs, new apartment construction, shifting migration patterns, and changing renter preferences all influenced the market.
Recent data shows that rental households grew faster than owner occupied households, while many cities experienced softer rent growth due to increased housing supply.
This article shares the latest property renting statistics for 2026, including rental market growth, rent prices, vacancy rates, affordability trends, renter demographics, migration patterns, and global rental market forecasts.
The data comes from in-depth research through online industry reports, housing research firms, government surveys, and rental market platforms. All data sources used in this article are attached below for better references.
10 Property Renting Statistics That Stand Out in 2026
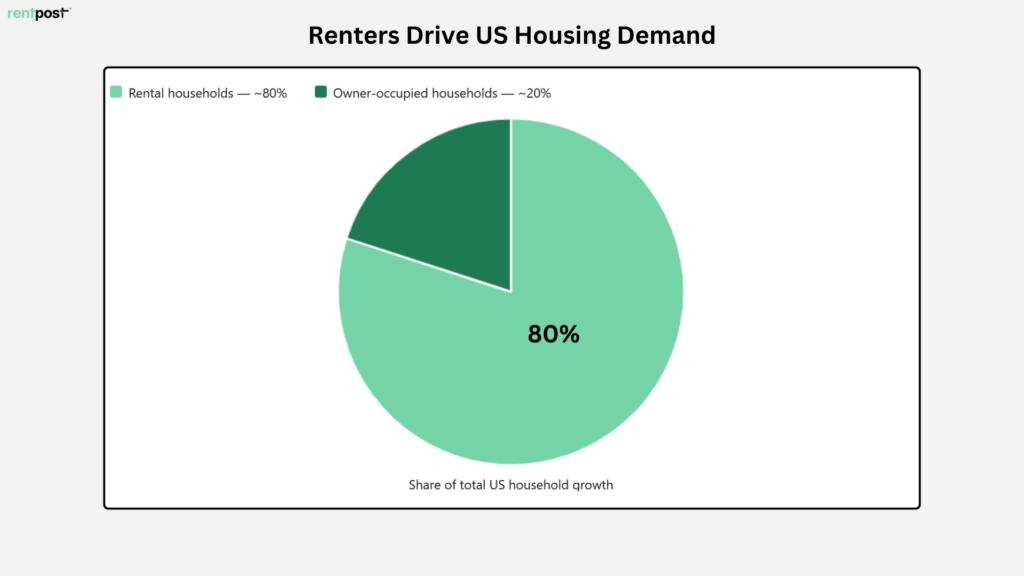
- Rental households drove nearly 80% of all household growth in the United States during 2025.
- Renting a starter home cost less than buying in all 50 largest US metro areas.
- Renters saved an average of $920 per month compared to homebuyers.
- Nearly 72% of middle income renters were considered cost burdened.
- Manhattan apartment rents surpassed $5,000 per month for the first time ever.
- Manhattan’s rental vacancy rate fell to just 1.55%, highlighting extremely strong demand.
- Developers completed more than 608,000 multifamily housing units, the highest level since 1986.
- Texas gained 72,680 renters, making it the top destination for renter migration.
- Apartment rents in Sydney jumped 51.5% between 2019 and 2026.
- The global short term rental market could grow from $153 billion in 2026 to $372 billion by 2035.
US Rental Market Growth and Demand Statistics
The US rental market continued to expand in 2026 as housing affordability challenges pushed more households toward renting. Rental demand remained strong across many parts of the country, while homeownership growth slowed. These trends helped rental housing account for a larger share of overall household growth and kept millions of Americans in the rental market.
- Rental households contributed nearly 80% of all household growth in the United States, making renting the primary driver of housing demand growth.
- The number of rental households reached 46.1 million in 2025 after growing by 2% compared to the previous year.
- About 898,000 new rental households entered the market during 2025, marking significantly faster growth than owner occupied housing.
- Owner occupied households increased by only 234,000, which represented annual growth of just 0.3%.
- The national homeownership rate stood at 65.3% during the first quarter of 2026 despite continued demand for rental housing.
- Nearly 6 in 10 renters planning to move within the next year said they intend to continue renting, while only 37% expect to purchase a home.
Apartment Rent Price Statistics and Trends
Rent prices remained one of the biggest concerns for renters in 2026. Although rents declined from their 2022 peaks in many markets, they remained well above pre pandemic levels. Recent trends also show differences across unit sizes, regions, and cities as new housing supply helped slow rent growth in some areas.
- The average US apartment rent reached $1,730 per month in April 2026 after recording five consecutive months of monthly rent growth.
- The national median asking rent across the 50 largest US metros stood at $1,669 in March 2026, which was still 17.5% higher than pre pandemic levels.
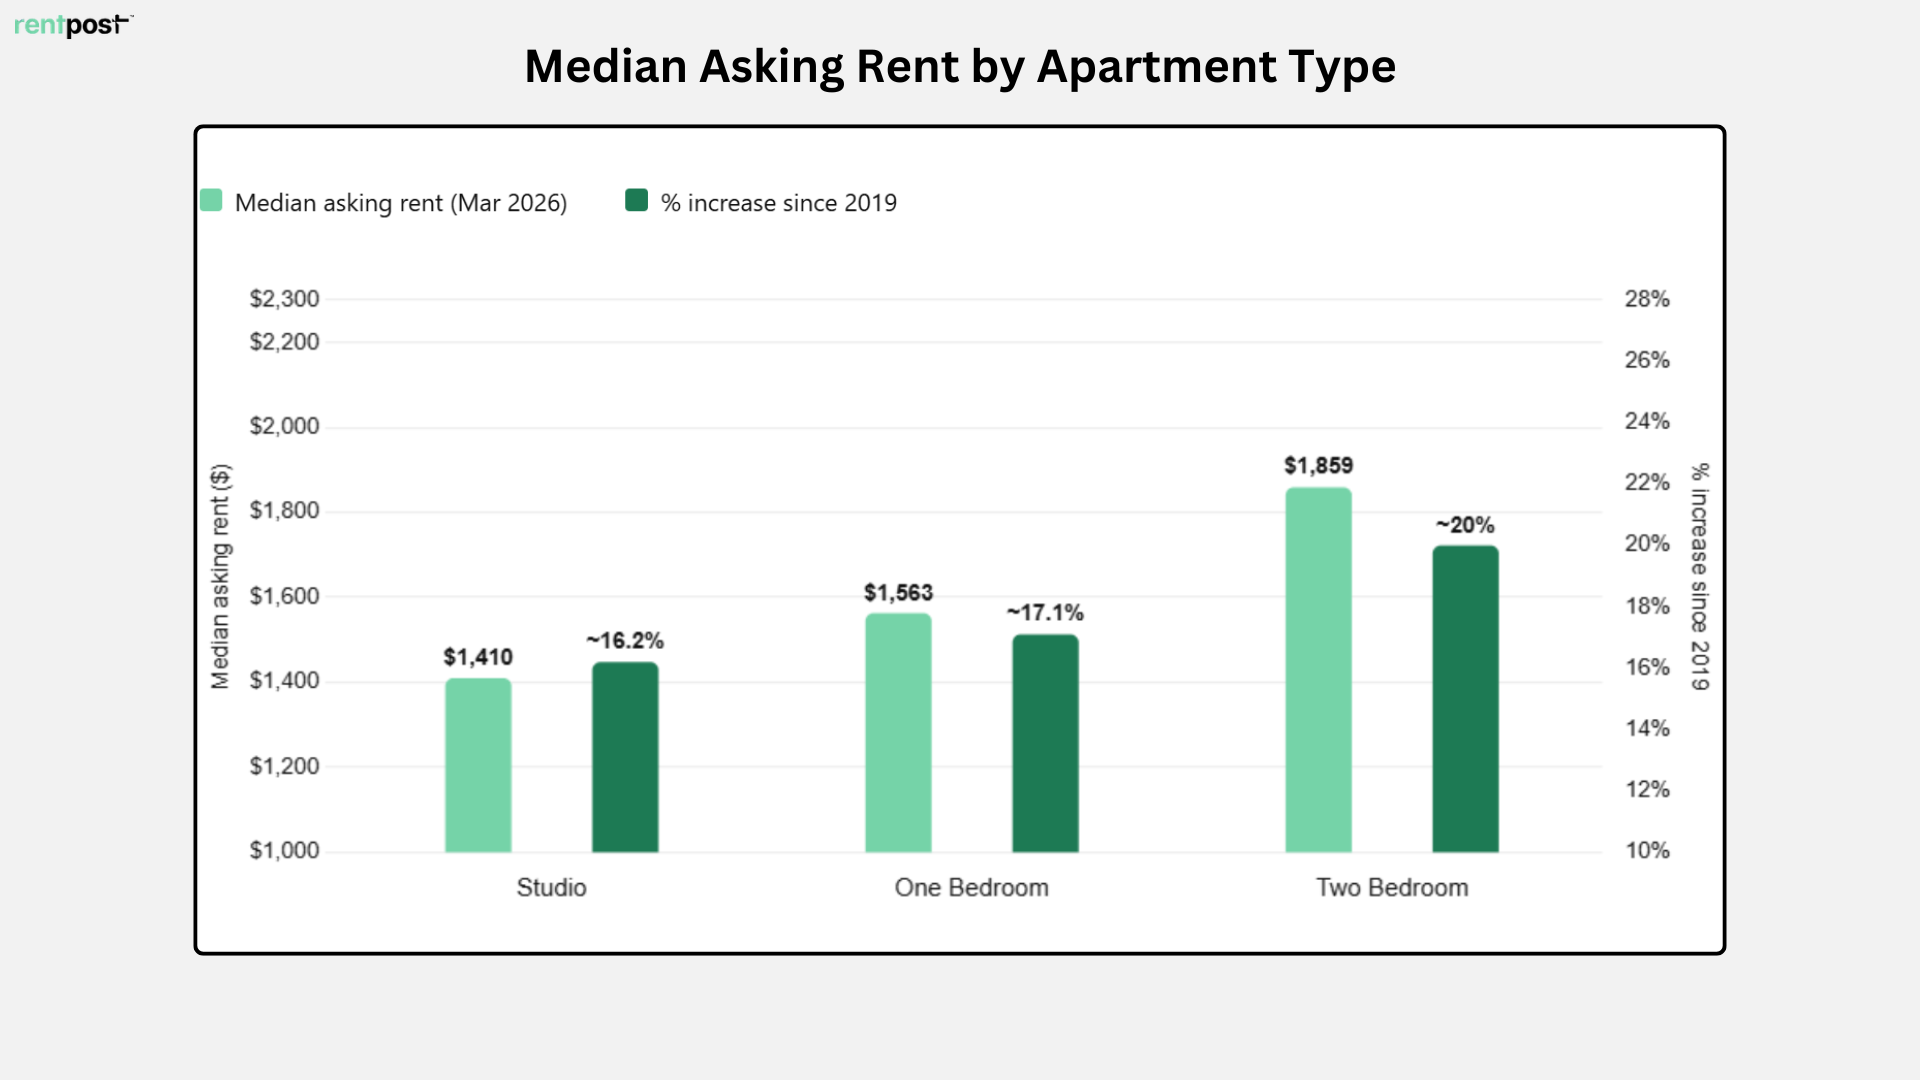
- Studio apartments recorded a median asking rent of $1,410 in March 2026, remaining 16.2% higher than seven years ago despite recent declines.
- One bedroom apartments reached a median rent of $1,563 in March 2026, which was 17.1% higher than in March 2019.
- Two bedroom apartments recorded a median asking rent of $1,859 in March 2026, nearly 20% higher than seven years earlier.

- US apartment rents increased by 0.2% between March and April 2026, extending the market’s recovery after weaker performance during late 2025.
- Annual rent growth slowed to 0.5% in April 2026, compared with 1.4% recorded one year earlier.
- Experts expect national apartment rents to grow by approximately 2.3% during 2026 as rental demand continues to absorb new housing supply.
- Nearly 72% of renters earning between $30,000 and $44,999 per year were considered cost burdened because they spent a large portion of their income on rent.
- The national median asking rent across major US metros remained $249 higher than pre pandemic levels despite recent rent declines.
Rental Vacancy Rates and Market Balance Statistics
Rental vacancy rates help measure the balance between housing supply and renter demand. Higher vacancy rates usually give renters more choices and better negotiating power, while lower vacancy rates often increase competition for available properties. Vacancy trends also help identify which housing markets favor renters and which continue to favor landlords.
- The US rental vacancy rate reached 7.3% during the first quarter of 2026, marking a notable increase from the tight rental market conditions seen in recent years.
- Rental vacancy rates across the 50 largest US metro areas averaged 7.6% in 2025, exceeding both 2024 levels and the pre pandemic average.
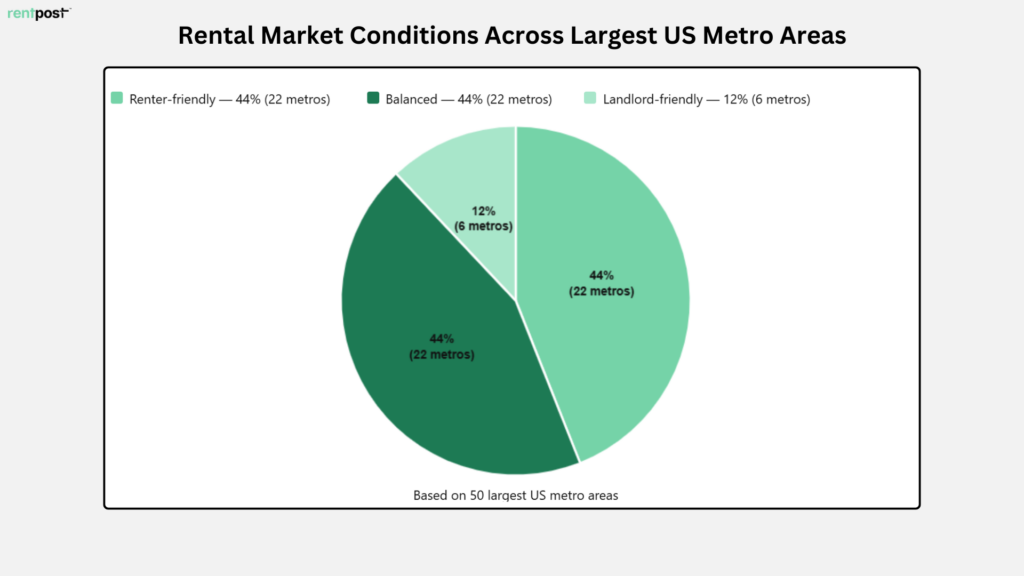
- Twenty two of the nation’s 50 largest metro areas qualified as renter friendly markets due to higher housing availability and slower rent growth.
- Another 22 major metros maintained balanced conditions, while only six markets continued to favor landlords.
- Birmingham recorded the highest rental vacancy rate among major renter friendly markets at 14.3%, followed by Austin at 13.8%.
- Milwaukee experienced one of the largest market shifts after vacancy rates more than doubled to 10.8%, moving from a landlord friendly market to a renter friendly one.
- Boston remained one of the tightest rental markets in the country with a vacancy rate of just 3.2%, while New York recorded a vacancy rate of 4.6%.
Apartment Construction and Housing Supply Statistics
Housing supply plays a major role in shaping rental markets. When developers add more apartments and multifamily properties, renters usually gain more options and rent growth often slows. Recent construction activity has increased rental inventory across several major markets, helping ease pressure on housing demand.
- Developers completed more than 608,000 multifamily housing units across the United States in 2024, marking the highest annual total since 1986.
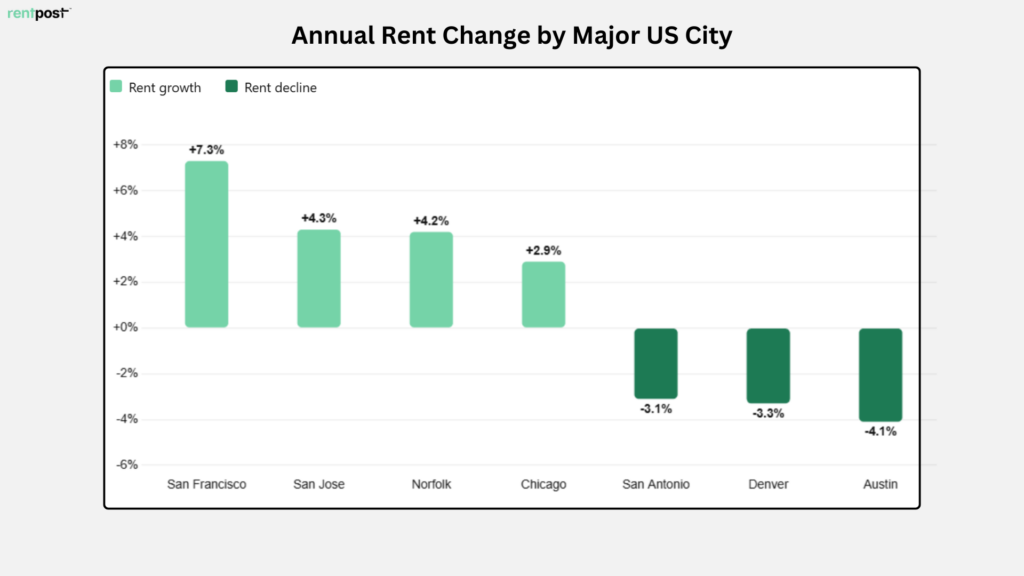
- Austin recorded a 4.1% annual decline in rents as new housing supply continued to outpace renter demand.
- Denver experienced a 3.3% year over year rent decline as a growing number of apartment completions increased housing availability.
- San Antonio saw rents fall by 3.1% annually, making it another major market where expanding housing supply reduced pricing pressure.
City Level Rent Growth Affecting Rental Market Statistics
Rental conditions can vary widely from one city to another. Some markets continue to experience strong rent growth because of high demand and limited availability, while others have seen rents decline as new housing supply enters the market. These city level statistics highlight some of the biggest rental market shifts in 2026.
- San Francisco recorded the strongest monthly rent growth among major US cities in April 2026, with rents increasing by 1.0%.
- San Jose and Boston followed closely behind, with monthly rent growth reaching 0.7% in both cities.
- San Francisco also led annual rent growth among major metros, posting a 7.3% increase compared to the previous year.
- San Jose reported annual rent growth of 4.3%, while Norfolk recorded a 4.2% increase year over year.
- Chicago apartment rents increased by 2.9% annually, making it one of the fastest growing rental markets in the Midwest.
- Manhattan apartment rents exceeded $5,000 per month for the first time in 2026 as demand continued to outpace available inventory.
- Manhattan’s rental vacancy rate dropped to just 1.55%, making it one of the most competitive rental markets in the country.
Renting vs Buying Cost Comparison Statistics
Many Americans continue to compare the cost of renting with the cost of homeownership before making housing decisions. Higher home prices, mortgage rates, and monthly ownership costs have kept renting more affordable in many parts of the country. These statistics highlight the growing financial gap between renting and buying.
- Renting a starter home remained more affordable than buying in all 50 of the largest US metro areas during March 2026.
- Renters saved an average of $920 per month compared to the cost of purchasing a starter home across the top 50 metros.
- Buying a starter home cost 55.1% more than renting in March 2026, although the gap narrowed from 62.3% one year earlier.
- The 10 US metros that favored renting the most showed an average monthly cost difference of $1,628, making homeownership nearly twice as expensive as renting.
- Austin ranked as the most renter friendly major market, where buying a starter home cost $3,080 per month compared to an average rent of $1,361.
- Homebuyers in Austin paid about 126.3% more each month than renters, creating a monthly savings opportunity of $1,719 for those who rented.
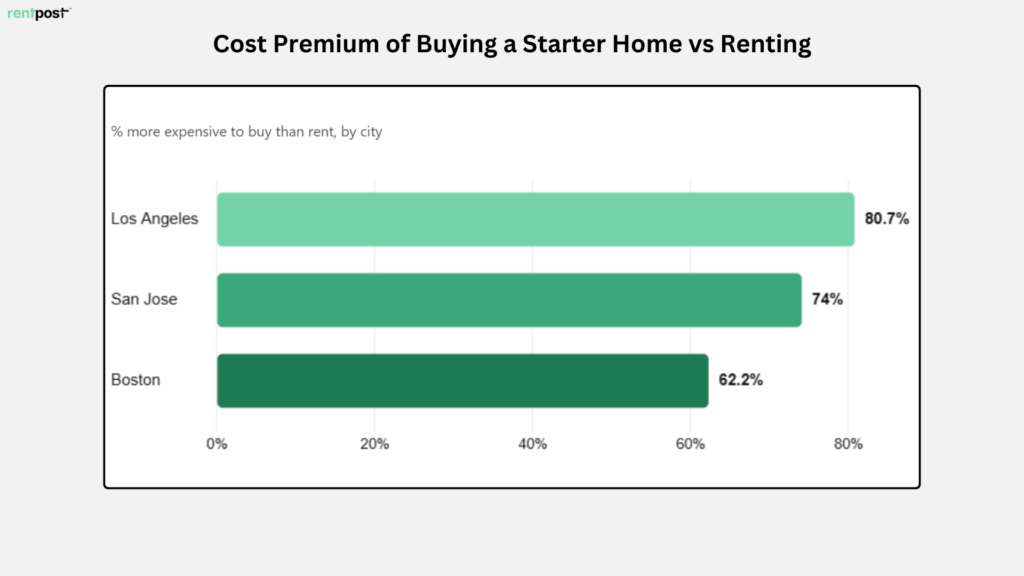
- Buying a starter home cost 80.7% more than renting in Los Angeles, 74.0% more in San Jose, and 62.2% more in Boston.
Renter Migration and Relocation Statistics
Migration trends show where renters are choosing to move and which markets are attracting the most housing demand. Job opportunities, housing costs, lifestyle preferences, and local economic conditions often influence these decisions. Recent migration patterns reveal that affordability remains a major factor for many renters.
- Texas became the leading destination for renter migration in 2026, attracting more renters than any other US state.
- Net renter migration added 72,680 renters to Texas as households moved in search of lower housing costs and stronger job opportunities.
- About 41% of Gen Z renters said economic conditions made them consider moving to a less expensive area, the highest share among all generations.
- Nearly 32% of Gen Z renters considered living with roommates or in shared housing arrangements to help manage rising housing costs.
Renting Trends by Generation Statistics
Different generations view renting in different ways. Younger renters often value flexibility and mobility, while older renters may focus more on long term housing stability. Economic conditions, affordability concerns, and future homeownership goals continue to shape how each generation approaches renting.
- Nearly 47% of Gen Z renters said flexible lease options make renting worthwhile for the long term, compared to 32% of Millennials.
- One in five Gen Z renters said they are not interested in buying a home because they do not plan to stay in one location for the long term.
- Renting serves as a stepping stone to homeownership for 39% of Millennials, the highest share among all generations.
- Nearly 46% of renters described their renting experience as somewhat or very positive, compared to only 20% who viewed it negatively.
- Settling in one location remained the preferred choice for 44% of renters, while 32% valued having the flexibility to move when needed.
- Gen Z showed the strongest confidence in future homeownership, with 33% saying they believe owning a home is very likely.
- Millennials followed closely behind, with 31% saying they see homeownership as a realistic goal in the future.
- More than one third of Boomers, at 37%, said homeownership was very unlikely for them, the highest share among all generations.
Global Property Rental Market Statistics
Rental markets across the world continue to face pressure from housing shortages, population growth, and changing affordability conditions. While some countries are seeing strong rent increases, others are dealing with supply constraints that continue to push demand toward rental housing. These statistics highlight major trends shaping the global rental market.
- The global online home rental market reached an estimated value of $26.47 billion in 2026 and could grow to $56.58 billion by 2033.
- The online home rental market is projected to expand at a compound annual growth rate of 13.5% between 2026 and 2033.
- Around 69% of property professionals worldwide expect rents to continue rising across major property sectors during 2026.
- Apartment rents in Sydney increased by 51.5% between 2019 and 2026, making it one of the fastest growing rental markets among major global cities.
- Germany’s residential construction activity fell to its lowest level in 13 years during 2025, adding further pressure to rental demand across Europe.
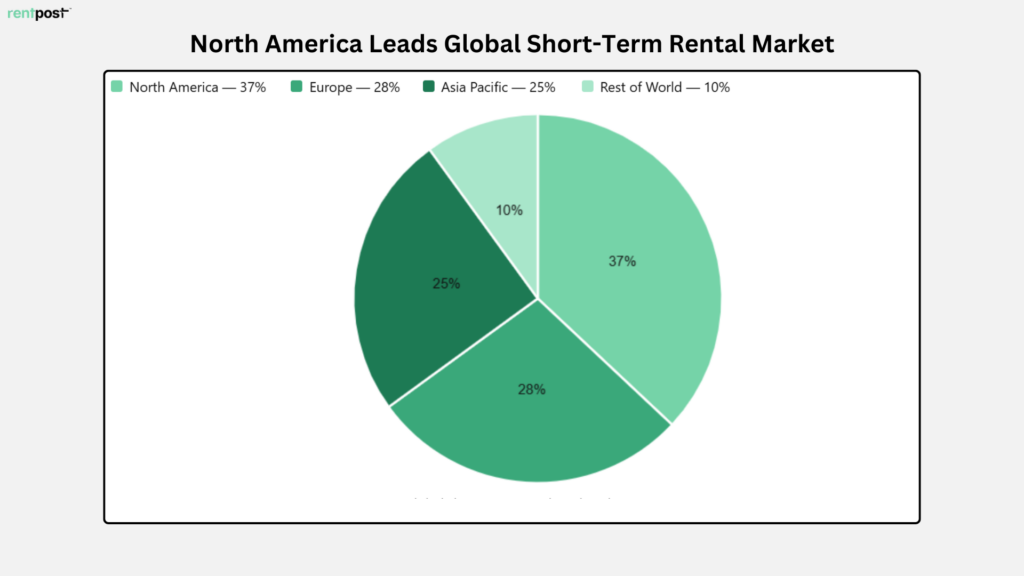
- North America remained the largest short term rental market in 2025, accounting for 37% of global market share.
- Europe and Asia Pacific represented 28% and 25% of the global short term rental market, making them the second and third largest regional markets worldwide.
Short Term Rental Industry Statistics
Short term rentals have become an important part of the global property market. Growing travel demand, remote work trends, and online booking platforms continue to drive growth across many countries. The sector is expanding faster than many traditional real estate segments and is expected to attract significant investment over the next decade.
- The global short term rental market reached $153.06 billion in 2026, making it one of the largest segments within the broader rental economy.
- Industry projections suggest the market could grow to $371.54 billion by 2035, adding more than $218 billion in new market value over the next decade.
- The short term rental sector is expected to grow at a 10.41% annual rate through 2035, outpacing growth in many traditional real estate categories.
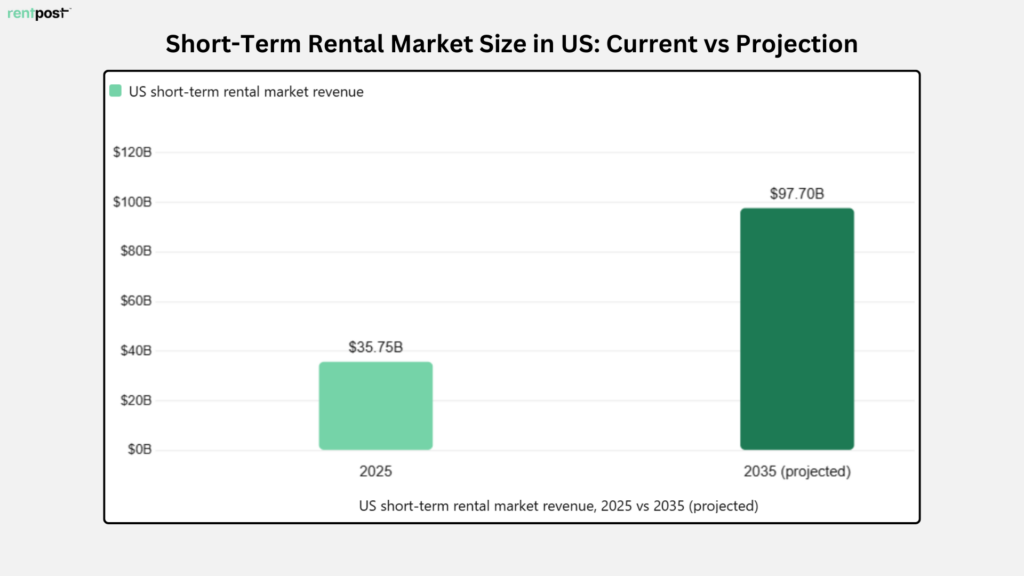
- The US short term rental market generated $35.75 billion in 2025, accounting for nearly one quarter of global market value.
- Revenue from the US short term rental market could reach $97.70 billion by 2035, reflecting strong demand for vacation rentals and flexible stays.
Manage Rental Properties More Efficiently With RentPost
The property rental market continues to grow as millions of households choose renting over homeownership. While demand remains strong, property managers must also handle rent collection, tenant communication, maintenance requests, leasing, accounting, and reporting more efficiently than ever.
RentPost helps property managers and landlords manage these tasks from one platform. The software includes online rent payments, tenant screening, work order management, rental accounting, reporting, and leasing tools designed to simplify day to day operations.
Founded in 2009, RentPost has helped thousands of property managers streamline rental management. With pricing starting at just $1 per unit per month, plus a free 30 day trial, it offers an affordable way to manage properties, tenants, and owners from a single dashboard.
Schedule a demo today to see how RentPost can help simplify your property management operations.
Data Sources
- https://arbor.com/blog/renters-now-represent-80-of-u-s-household-growth/
- https://www.zillow.com/research/renters-housing-trends-report-2025-35647/
- https://www.costargroup.com/press-room/2026/apartmentscom-releases-multifamily-rent-growth-report-april-2026
- https://www.realtor.com/research/january-2026-rent
- https://www.census.gov/housing/hvs/index.html/
- https://www.realtor.com/research/march-2026-rent/
- https://www.mysanantonio.com/lifestyle/article/texas-renters-population-growth-2026-22258764.php
- https://www.apartments.com/blog/data-reveals-where-renters-want-to-move-2026
- https://nypost.com/2026/05/15/real-estate/manhattan-rents-soar-to-highest-ever-level-with-5k-median-and-raging-bidding-wars/
- https://www.coherentmarketinsights.com/industry-reports/online-home-rental-market
- https://use.rently.com/blog/rently-2026-renting-by-generation-report/
- https://www.precedenceresearch.com/short-term-rental-market
- https://www.advisorperspectives.com/dshort/updates/2026/04/28/home-ownership-rate-q1-2026
Author